Monitor your Data-Tier named instance SQL Server with Nagios
A monitoring solution for on-prem environment
Introduction
Monitor as much you can (and as much you need)
— Anonymous DevOps engineer
One of the fundamentals of the DevOps approach is the continuous monitoring. This is true for our business systems which are used by our customers as well as our backend systems (like the Azure DevOps Server itself), which are used by our staff.
Server uptimes, performance, (hopefully) running services and applications, etc., all this kind of stuff is very important to business continuity. Using Azure you’re in an easy situation, and you have many out-of-the-box solutions which can help you to deal with these tasks. But what if you have an on-premise environment with dozens of hosted servers and applications?
Don’t panic, there are also several options out there you can use to monitor your IT infrastructure. One example is Nagios and Centreon, which could be very powerful tools in your toolbox.
Background
Let’s imagine an Azure DevOps Server with a named instance SQL Server in the background. The service name related to this database server looks something like this: MSSQL$MyInstance.

The same is true for the other services which were shipped and installed on your Data-Tier::
- SQLAgent –> SQLAgent$MyInstance
- Full-text Filter Daemon Launcher –> MSSQLFDLauncher$MyInstance
- etc…
I don’t think many of us found any surprises in the text above, so let’s go on with the monitoring system.
The Swiss knife
As I mentioned above, both Centreon and Nagios are very serious players in the monitoring area, with tons of possibilities and applicable use cases.
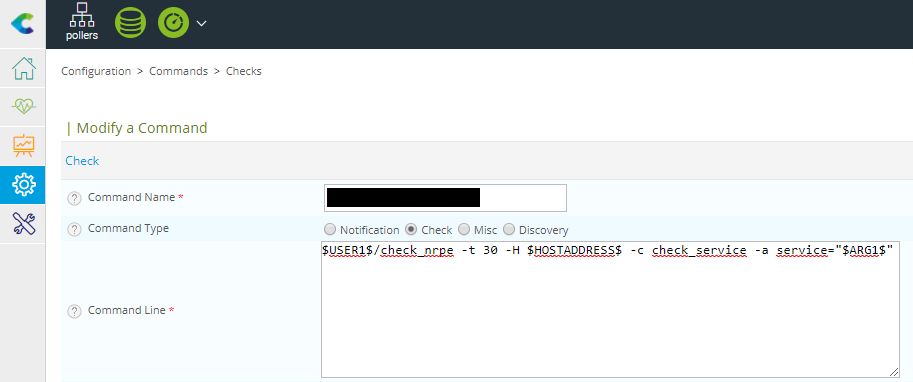
So, in our case, we want to monitor our Full-text Filter Daemon Launcher and SQLAgent services. Checking a service heartbeat is pretty easy with Nagios nrpe plugin (documentation is here for real ninjas) and you can setup the whole thing on the Centreon UI (Configuration>Commands>Checks) with very few characters:
$USER1$/check_nrpe -t 30 -H $HOSTADDRESS$ -c check_service -a service="$ARG1$"
Now you know the first part of the secret, so you can enter a proper name for the command, which will be used later in the service configuration.

You don’t care about the first and second parameter, so let’s focus on the third: $ARG1$. It tells Nagios the name of the observed service, which is in our case MSSQLFDLauncher$MyInstance.
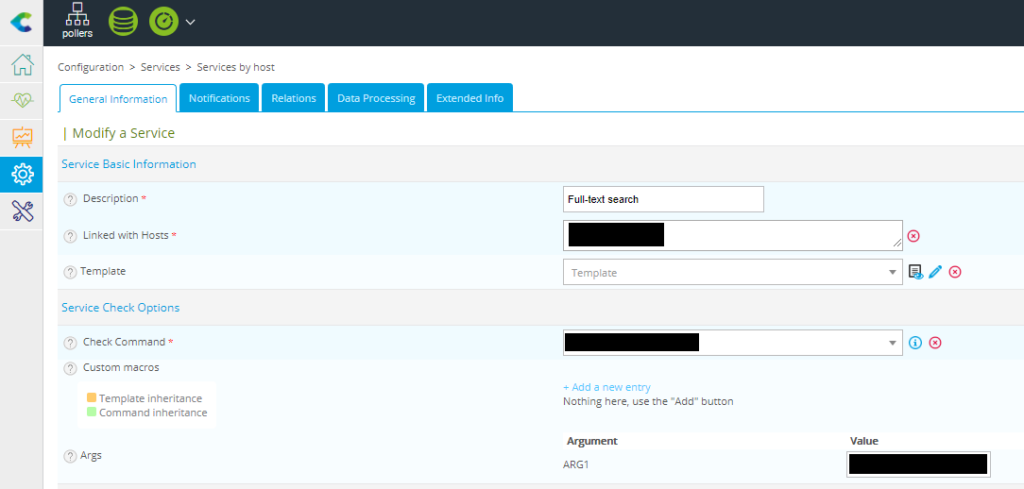
Let’s move to the service configuration menu where you can use your created command.

After giving an informative name for your service, choose the targeted host, select the previously defined check command from the list, and give a value for the argument named ARG1.
Sounds easy, doesn’t it? But things will be complicated if you use a named instance service rather than just a simple service:
- If you enter the service name in a simple manner (MSSQLFDLauncher$MyInstance), you’ll fail.
- If you try to use any kind of quotation marks, you’ll fail.
- If you try to use slashes (forward, backslash, more slash…), you’ll fail.
- If you try to use any combinations of the above, you’ll fail.
At this point maybe you want to use this blunt Swiss knife for something other than monitoring your infrastructure!
Sharpening the knife
Ok, so what is the solution?
MSSQLFDLauncher\$$MyInstance
Did you notice the doubled $ of the correct value for ARGS1? Yeah, it’s weird…
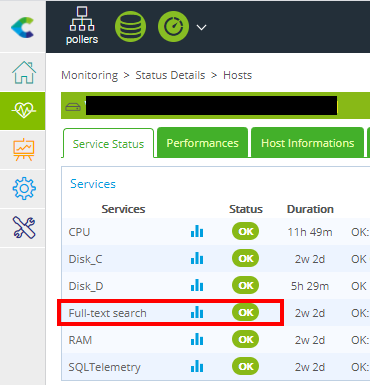
After setting the correct argument for the service, Nagios can interpret the input and will show the status of the monitored services, like this:

Key takeaway
Nothing special, just a pun. Everybody talks about CI/CD in the DevOps scene which means Continuous Integration and Continuous Deployment.
But we can find another meaning of this abbreviation:
Continuous Improvement + Continuous Development, which leads CL, a.k.a Continuous Learning.
So, keep learning folks!
Finally, I want to say a big thanks to Laurel Raven, who shared the original idea of how to solve this problem.

