
The importance of the order when using rules in dashboard tiles
Practical usage pattern of Query Tiles
Colors and its meanings
I like the color green, particularly on a dashboard. I think the Dashboard is a handy tool in AzureDevOpServer, especially when you want to evaluate or deep dive into the progression of the development based on facts
One of my favorite widgets is the Query Tile, which works well with query results. These results are just pure data without any meanings. A piece of data will be useful for us if we can transform it into information, but, to do this transformation, we need to evaluate the data.
Here come the rules into the picture. In general - in any kind of programming language - a standard evaluation (I mean transforming data to information) looks like this. Beware, pseudo-code is coming…
let tileColor = blue;                                   // default color
let data = 4;                                            // raw data
if (data = 0) then tileColor = green;                   // we're happy
if (data > 0 and data < 5) then tileColor = yellow;  // not so bad...
if (data >= 5) then tileColor = red;                 // Houston!
In the code above the information is the color, more precisely the value of the color variable, which we can process as humans, and based on this, we can make some decisions.
Implementation
Let’s go to the dashboard in AzureDevOps Server, and try to make something similar. Getting data, evaluating it based on rules, and showing the information to the humans.
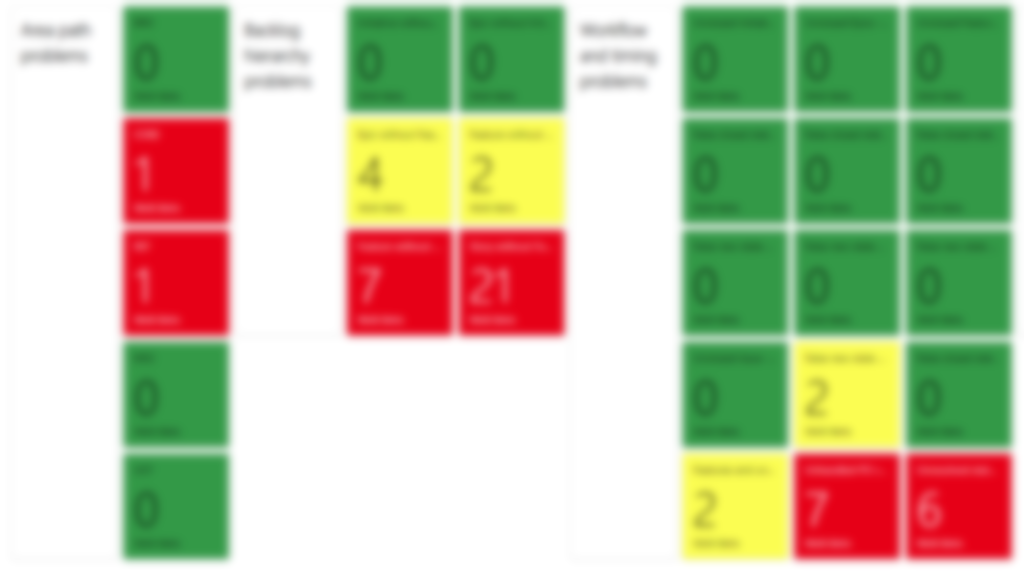
Let’s imagine an AzureDevOps dashboard with many tiles, like this.
In our situation, we want to use query tile to check the states between work items with parent-child hierarchy, searching for and showing inconsistencies in our backlog. What kind of problems can we face?
- an Epic is in New state, but one of its child Features is in Active state
- there is an Epic in Closed state, but the child Feature is currently unclosed
- Feature in Active state has one or more child items (User Story or Bugs) in Closed state
- etc…
Let’s try to program the query tile with some rules, like in the pseudo-code above, and try to make the necessary information from data.
The Pan-African flag with the colors green-yellow-red looks good in the background on the left side (but, to be honest the green is my favorite color in a dashboard, did I mention it?).
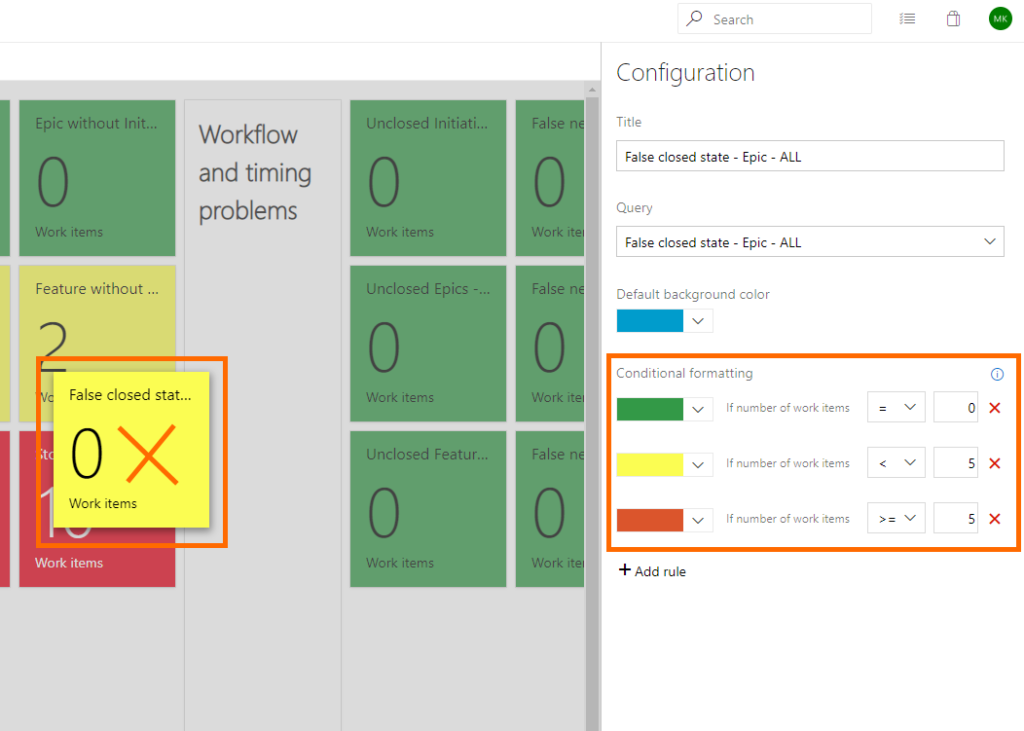
But wait! Something is wrong with the edited title… the value of the data is 0, but the color of the tile is yellow. It should be green! Where we made a mistake in the ‘program’, what’s wrong with the evaluation?
Well, we did almost everything correctly, except for the order of the rules. If we change the order of the first and the last rule, it will work well.
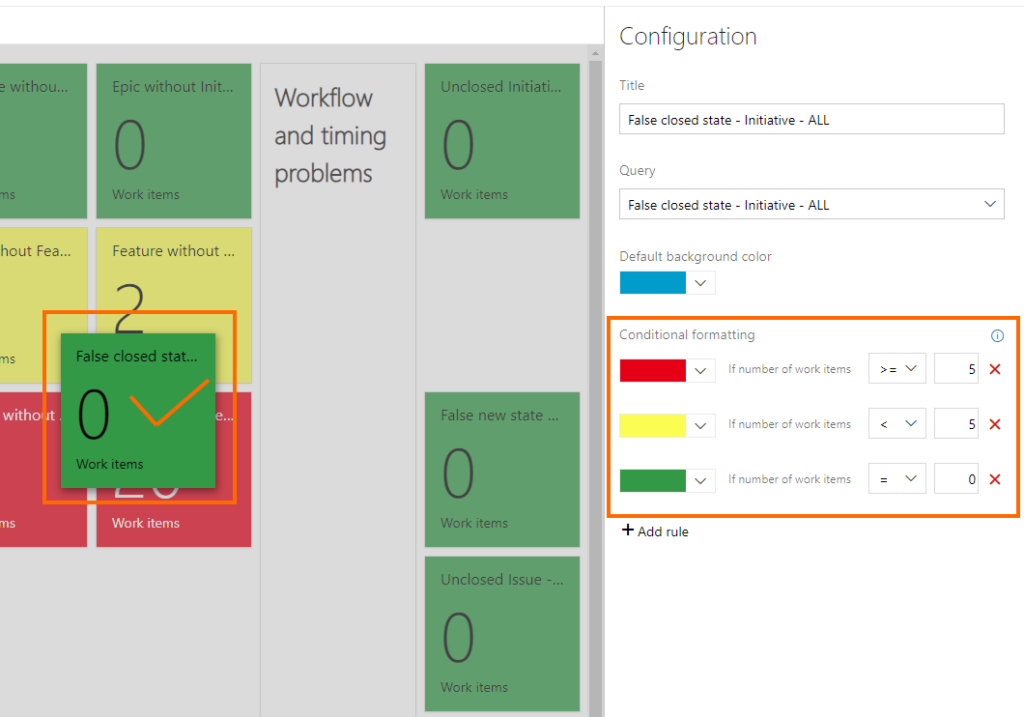
What a surprise, now we get real and valuable information from the dashboard.
I haven’t found any resource/documentation, which describes the reason in more detail, but if I have to summarize the general rule, it would be like this:
- if we fail at the first rule, we’ll jump into the next evaluation section
- if the outcome of the first evaluation is true, we’ll jump into the next evaluation section (no, it isn’t logical…)
- if we fail at the second rule, we’ll dive into the next evaluation section
- if the outcome of the second evaluation is true, we’ll jump into the next evaluation section (yes, it’s still illogical…)
- and so on…
- if the last evaluation is true, we’ll use its setting coloring the tile’s background
- if neither of the conditions are true, we use our fallback option, which is the default background color setting in our ‘program’.
Wrap up
Maybe this way looks like a low-budget solution, following the states in the backlog and looking for an inconsistent state without automation, but it works well, and it needs minimal effort in the daily operation. On the flip side, we can check all levels of our backlog very quickly and easily, and we’ll have accurate and real information about the state of the development. And we have to trust that the teams keep the User Stories and Bugs in the proper states as well…
Afterword
Formerly there was a request by the community, to get some support from AzureDevOps Service/Server in an OOB way to change the state of the work items based on their parent/child relations automatically, but it ended up in an open-source solution.
Another thing I came across during my dashboard and query tile research is the Query Tile PRO. You can find detailed information about it in this article.
I haven’t tried those yet, but I’m interested in this topic. Do you have any kind of experience with any of these tools? Please share it with me.